
What 40 million evals taught us about temperature
Ada Fitzgerald
Research
11 min read
The question
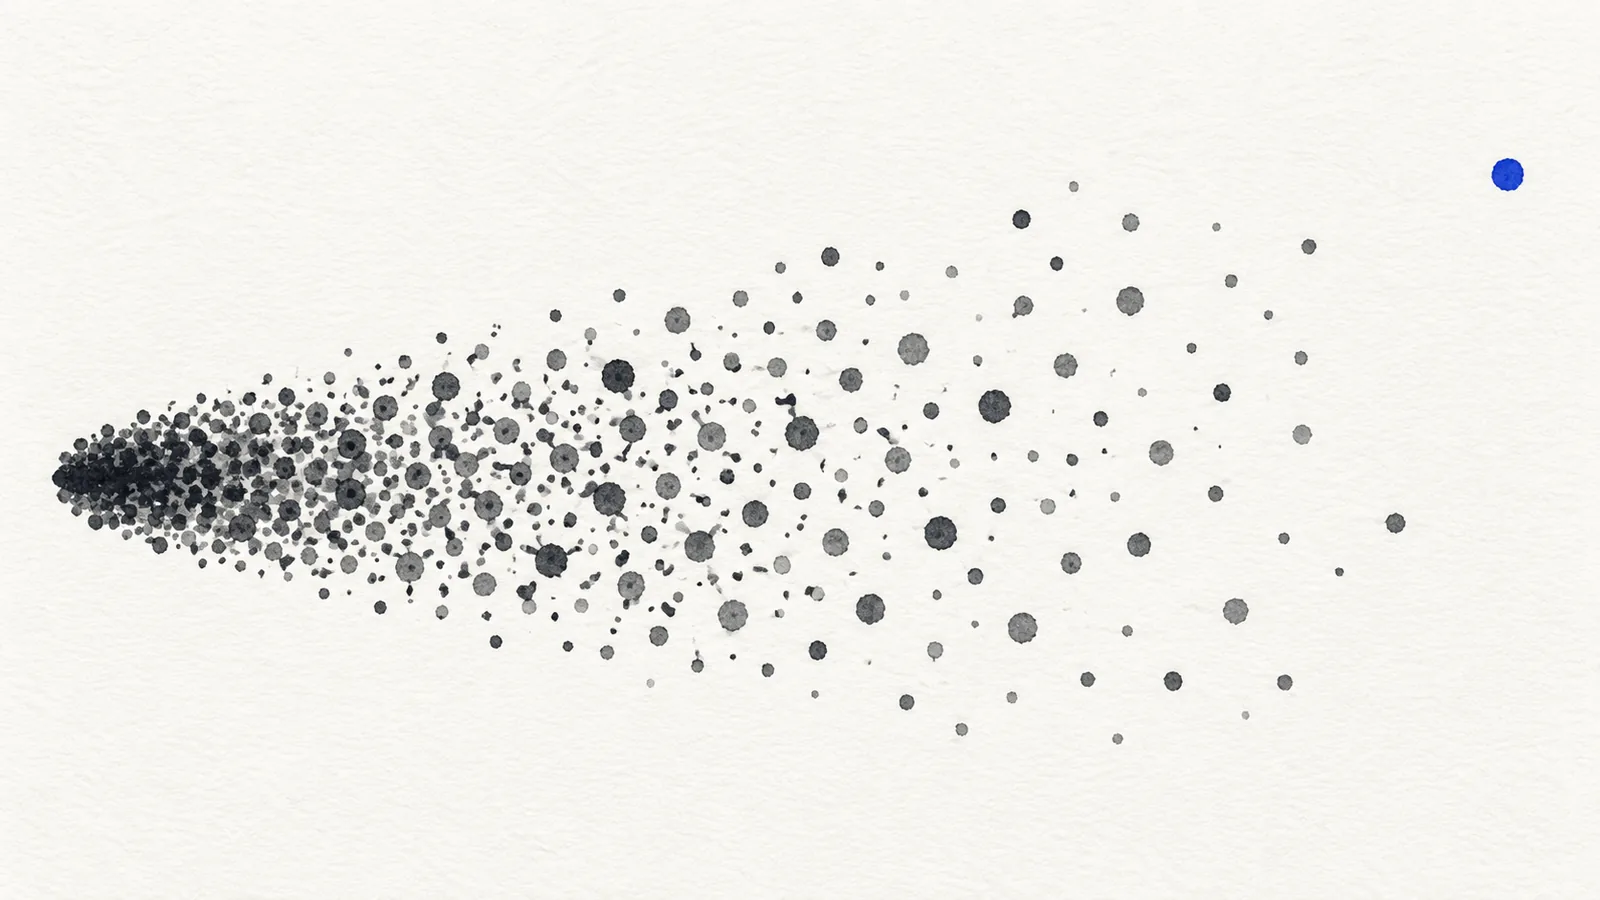
Temperature is the setting everyone has an opinion about and almost nobody has measured on their own workload. The folklore is stable: lower for extraction and classification, higher for anything that should read like a person wrote it. We wanted to know whether the folklore survives contact with an eval suite, and whether it holds the same shape on every model.
So we ran the same suites at eleven temperature settings, from 0 to 1.0 in steps of 0.1, across seven models from four providers, on four task families. Forty million graded calls over five weeks.
What we ran
Four task families, all drawn from suites our own customers run, anonymised and reduced to their shape: structured extraction from documents, classification into a fixed taxonomy, short factual summarisation, and open ended rewriting.
Every task was graded three ways: an exact or schema match where the task allowed it, a semantic similarity score against a reference, and a model graded rubric. We ran each cell of the grid thirty times, because the first thing we learned was that ten was not enough to say anything about spread.
The means were boring
Averaged across a suite, quality moved very little between 0 and 0.4. On extraction and classification, the mean score at 0.4 was within half a point of the mean at 0. On summarisation the curve was flat to 0.5 and then declined slowly. On rewriting the mean improved slightly to 0.6 on the rubric grader, which is the only place the folklore was clearly right.
If you only look at means, the conclusion is that temperature does not matter much below 0.5 and you should set it to whatever you like. That conclusion is wrong, and the reason is in the second moment.
The variance was the finding
Spread grows long before the mean moves. On extraction at temperature 0, the standard deviation across thirty runs of the same input was 0.004. At 0.3 it was 0.02. At 0.6 it was 0.11. The mean at 0.6 was still within a point of the mean at 0, but roughly one run in twelve now scored below a gate that the mean cleared comfortably.
This is the practical result. A suite that passes on average can fail intermittently, and intermittent failure on a gate is worse than consistent failure, because consistent failure gets fixed and intermittent failure gets retried.
We saw the same shape on every model and every task family. The temperature at which spread starts to grow differs, 0.2 on the smallest model we tested and 0.5 on the largest, but the shape does not.
Models disagree about what temperature means
The number in the request is not a standard. Two models at 0.7 do not produce comparable spread, and the difference between them is larger than the difference between 0.5 and 0.7 on either one alone. On one model, 0.7 sat roughly where another model sat at 0.45 in run to run variance on the same suite.
This matters if you route. A routing policy that sets one temperature for every model is applying a different setting to each of them, which is a strange thing to do on purpose. Set temperature per model in the policy, or leave it at 0 for anything gated.
Zero is not free either
Temperature 0 is not deterministic, and treating it as deterministic causes its own problems. Across our runs, the same input at temperature 0 produced a byte identical output 96% of the time on the best behaved model and 71% on the worst. Batching, load, and routine provider side changes all move it.
If your test suite asserts exact equality against a stored output, it will fail on a Tuesday for reasons that have nothing to do with your prompt. Assert on properties, not on bytes.
What we changed
Three things. Our default policy now sets temperature 0 for extraction, classification, and anything with a schema. Our eval runner reports the standard deviation across runs next to the mean, and a gate can be set on either. And the router does not treat a temperature set on the request as portable across models: if a policy pins temperature, it also pins the model, or it sets one per model.
The eval runner change was the one customers noticed. A suite that reports 0.94 plus or minus 0.002 is a different object from a suite that reports 0.94 plus or minus 0.09, and before this you could not tell them apart.
Caveats
All of this is measured on four task families that we chose because our customers run them. Creative writing is not among them, and the one thing everybody agrees temperature helps is the one thing we did not test.
Model graded rubrics have their own temperature. We ran the grader at 0 throughout, which removes one source of variance and adds a different bias, since a grader at 0 is consistently wrong in the same direction rather than noisily wrong in both.
Thirty runs per cell is enough to see the shape of the spread and not enough to characterise the tail. We can tell you that variance grows. We cannot tell you much about the worst run in a thousand, and the worst run in a thousand is what a gate actually protects you from.
If you want to run this yourself
You do not need forty million calls. The shape shows up in a few thousand: one suite, five temperatures, twenty runs each, and plot the standard deviation rather than the mean. On our data the interesting region was always between 0.2 and 0.6, and everything above 0.7 was noise you could see without statistics.
If you find a model where spread stays flat past 0.6 on a gated task, tell us. We did not find one, and we would like to.
Spread by task family
The four families did not respond the same way, and the differences are useful if you are deciding where to spend effort.
Extraction was the most sensitive. Standard deviation grew roughly twenty five fold between 0 and 0.6, and most of the failures were not wrong values but missing ones: a field the model filled at 0 and omitted at 0.5. If you gate on schema completeness, this is the family to pin at 0 and stop thinking about.
Classification degraded more gently and in a specific way. The mean held because the model kept choosing a correct label. The spread came from the boundary cases, the ones a human annotator would also argue about, and at higher temperatures those flipped between runs. A suite full of easy cases will show you almost no effect here, which is a good reason not to build a suite out of easy cases.
Summarisation had the widest spread at every setting including 0, which tells you more about semantic similarity as a grader than about the models. Two summaries can be equally good and score differently, and that noise floor sits underneath everything else you measure.
Rewriting was the only family where higher temperature improved the rubric score, and the improvement was small, about 1.5 points between 0.2 and 0.6, with variance growing faster than the mean. Whether that trade is worth taking depends entirely on whether anything downstream gates on the output.
The grader is part of the experiment
Halfway through we found that about a third of what we were calling model variance was grader variance. The rubric grader at temperature 0 still disagreed with itself across runs on the same pair of inputs, roughly 4% of the time, usually on answers near the threshold.
We now run every model graded rubric three times and take the median score, which costs three times as much and removes most of the grader noise. For exact match and schema graders this is unnecessary, which is another argument for using a deterministic grader wherever the task allows one.
If you are building your own suite, measure your grader against itself before you measure anything with it. Run the same input pair thirty times and look at the spread. If your grader is noisier than the effect you are trying to detect, every number after that is decoration.
What forty million calls actually bought
Three defensible recommendations, one product change, and a much better sense of what we do not know. The recommendations are in the section above. The product change was reporting spread next to the mean in every eval run.
The thing we do not know is how any of this behaves at the tail of the tail, and that is where gates live. We can tell you the standard deviation at 0.6. We cannot tell you what the worst run in ten thousand looks like, and if you are gating a medical or financial workflow, that is the number you actually need. Pin the temperature at 0 and spend your effort on the suite instead.
Something wrong in this post? Tell us at hello@plinth.dev and we will fix it and say so.
More from the team
Why we route on p95, not p50
Median latency is the number that makes your dashboard look good and your users leave. Here is the arithmetic that changed how our router scores models.
8 min read

The cache that made everything slower
We cached model scores to save 70 ms. It cost us 190 ms and a weekend. A short story about cache invalidation being one of the two hard problems.
6 min read

Zero-day retention, and what it cost us to build
Not storing something is harder than storing it. Nine months, one rewritten trace pipeline, and every debugging tool we had to give up.
9 min read

1M tokens a month, free forever.
No card, no trial clock, no sales call. Move to a paid plan when the invoice makes sense, or don’t.